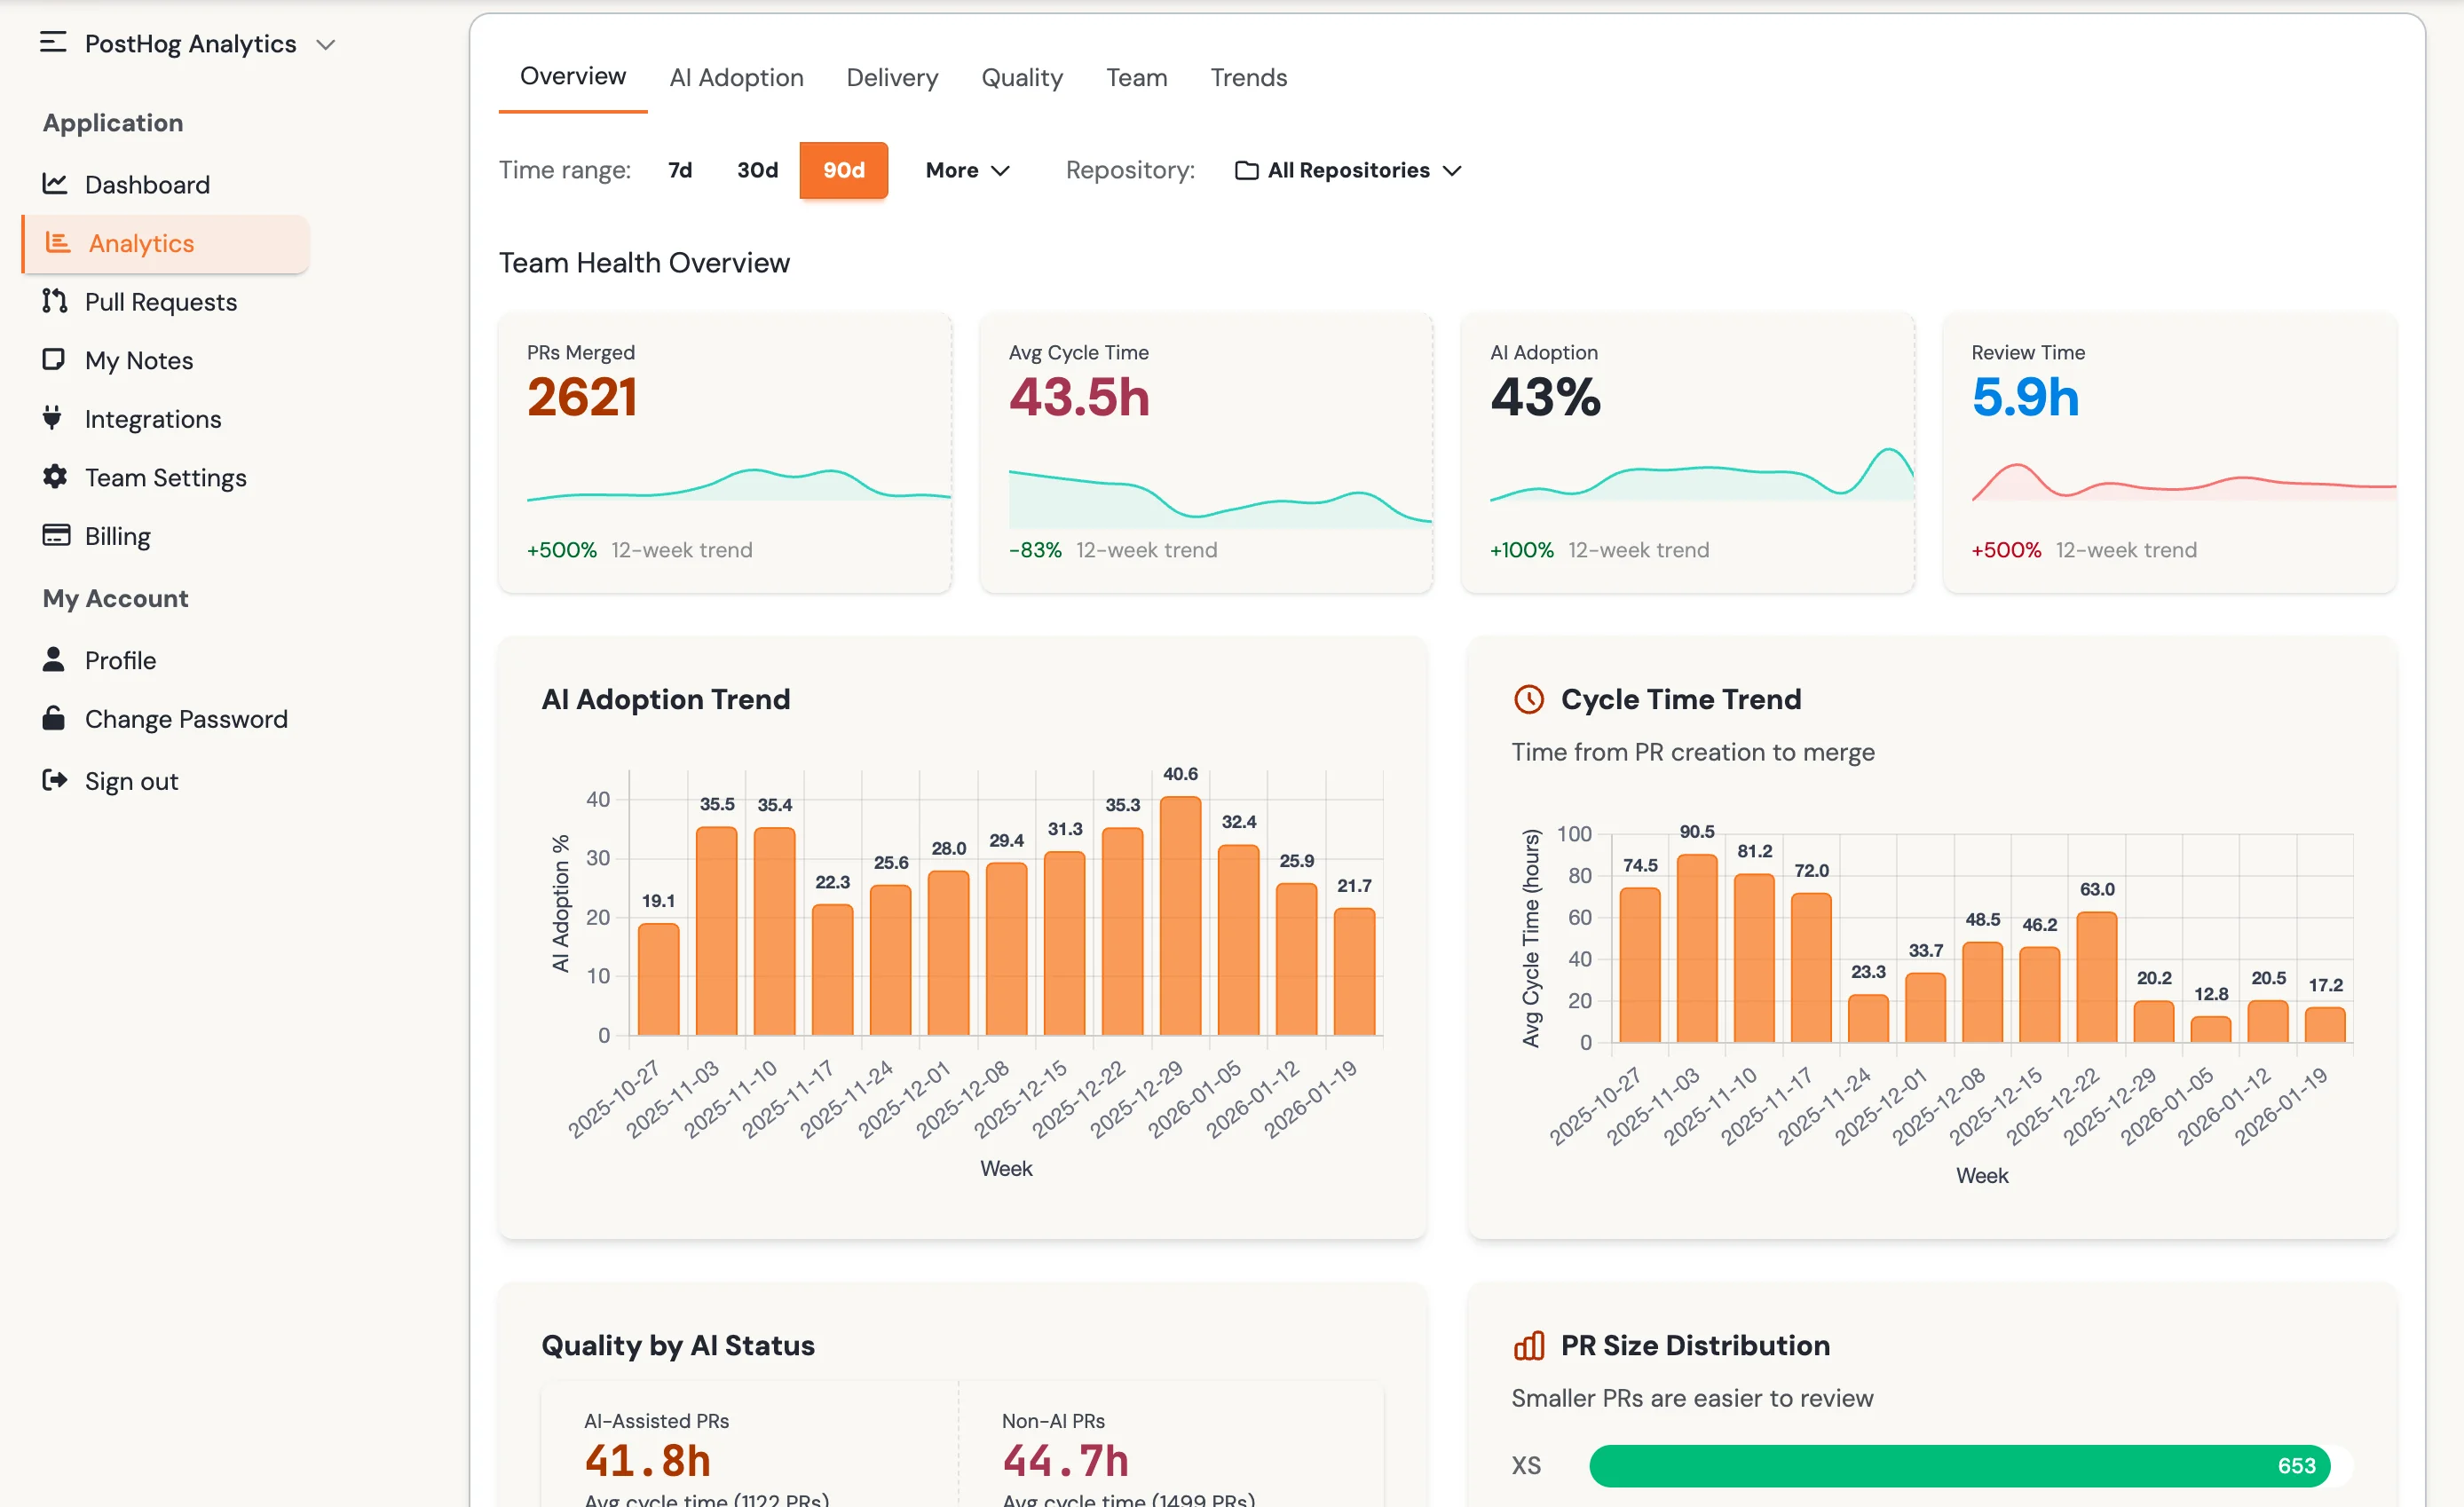
Cycle time, review load, PR flow, and trend changes from GitHub. Use AI-related signals as a secondary lens.
Key metrics cards show PRs merged, cycle time, review time. Health indicators flag what needs attention.
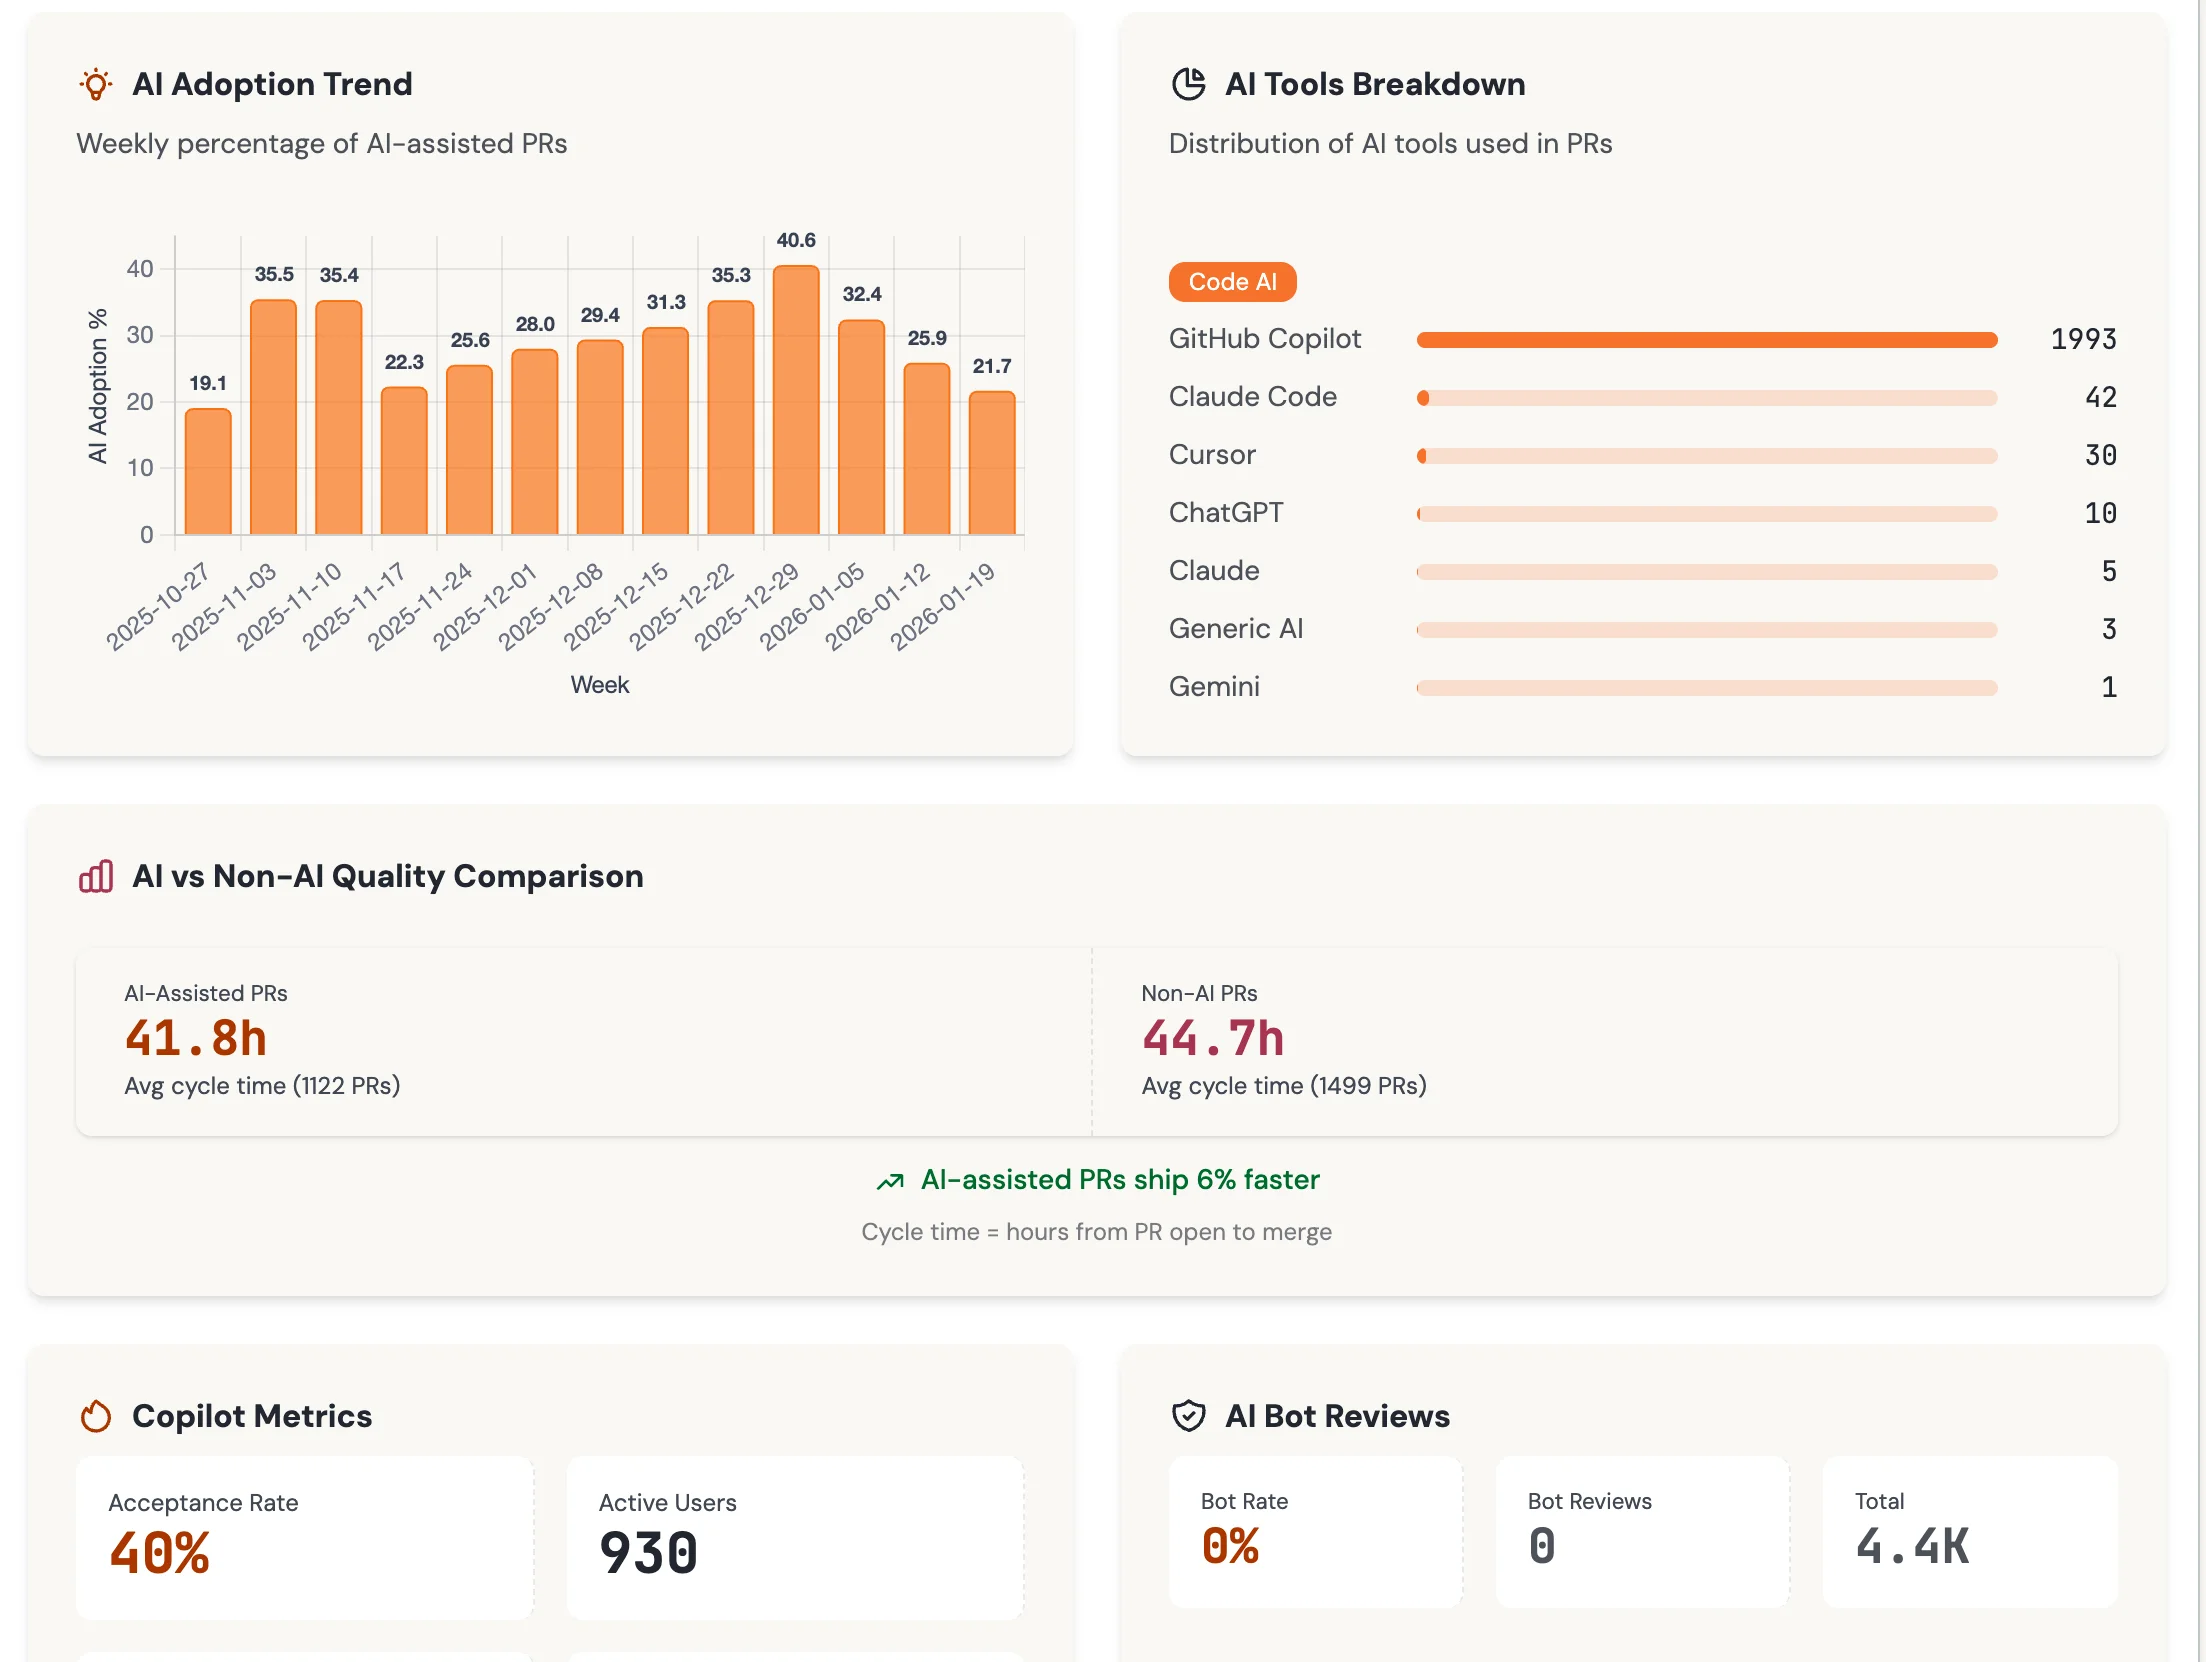
Compare delivery outcomes for work with and without AI-related signals. See whether review time and flow improve as the signal mix changes.
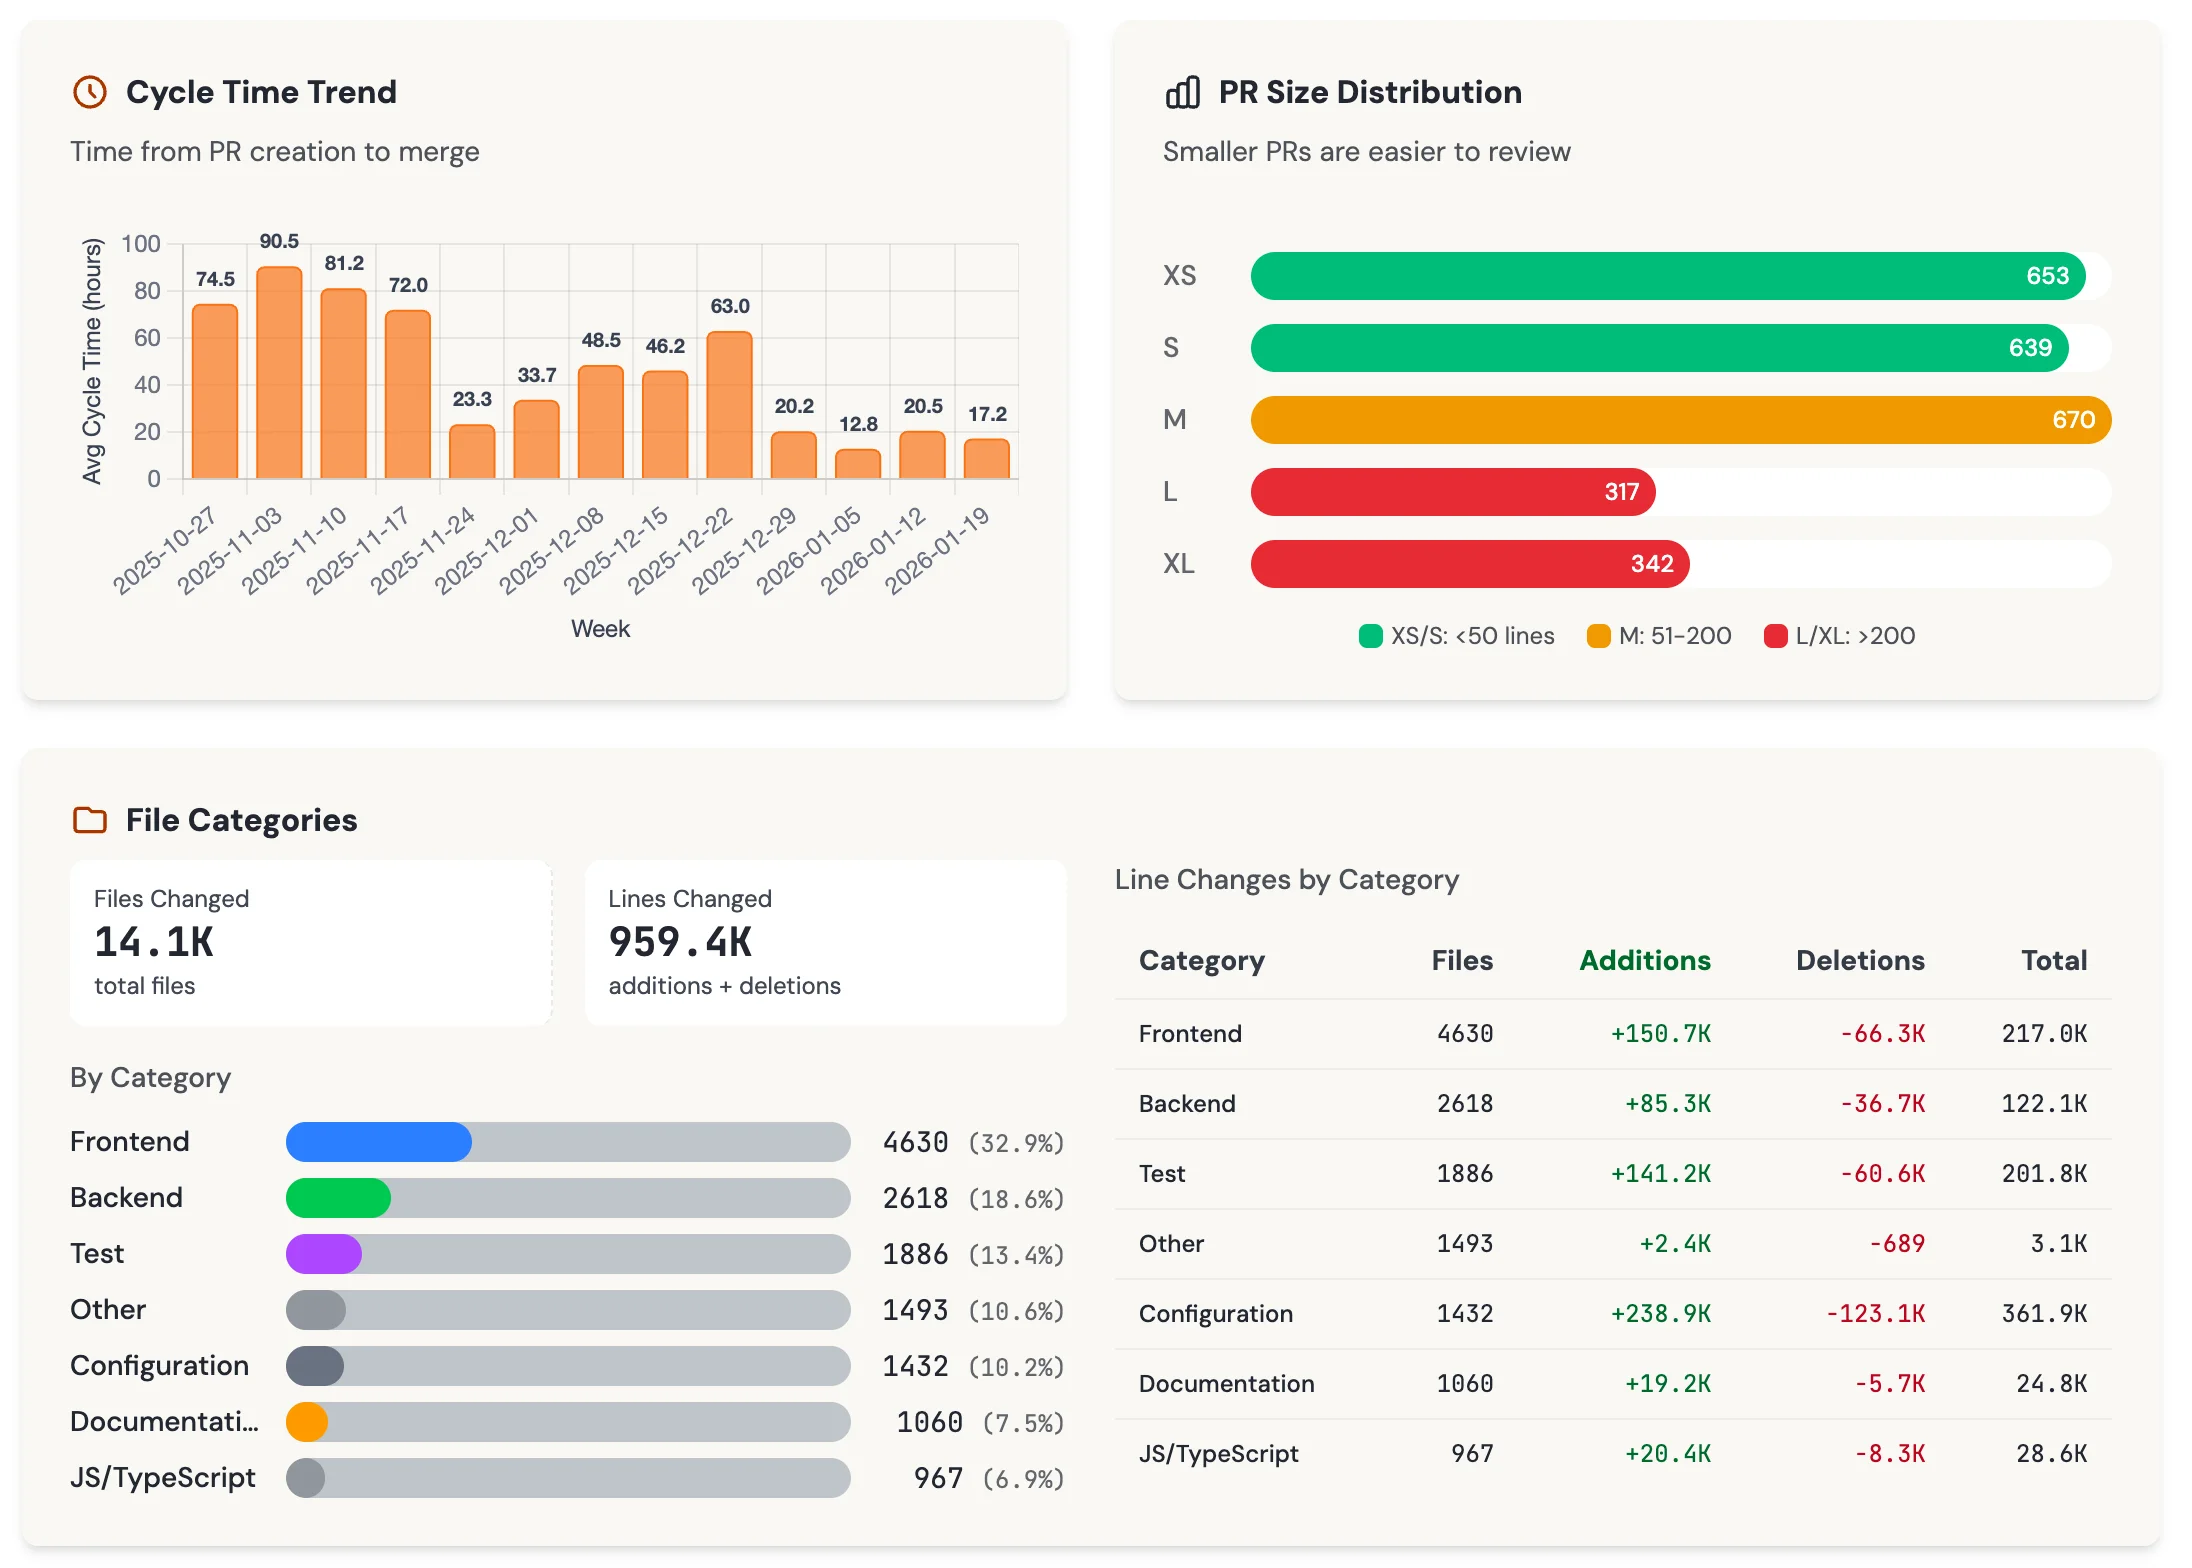
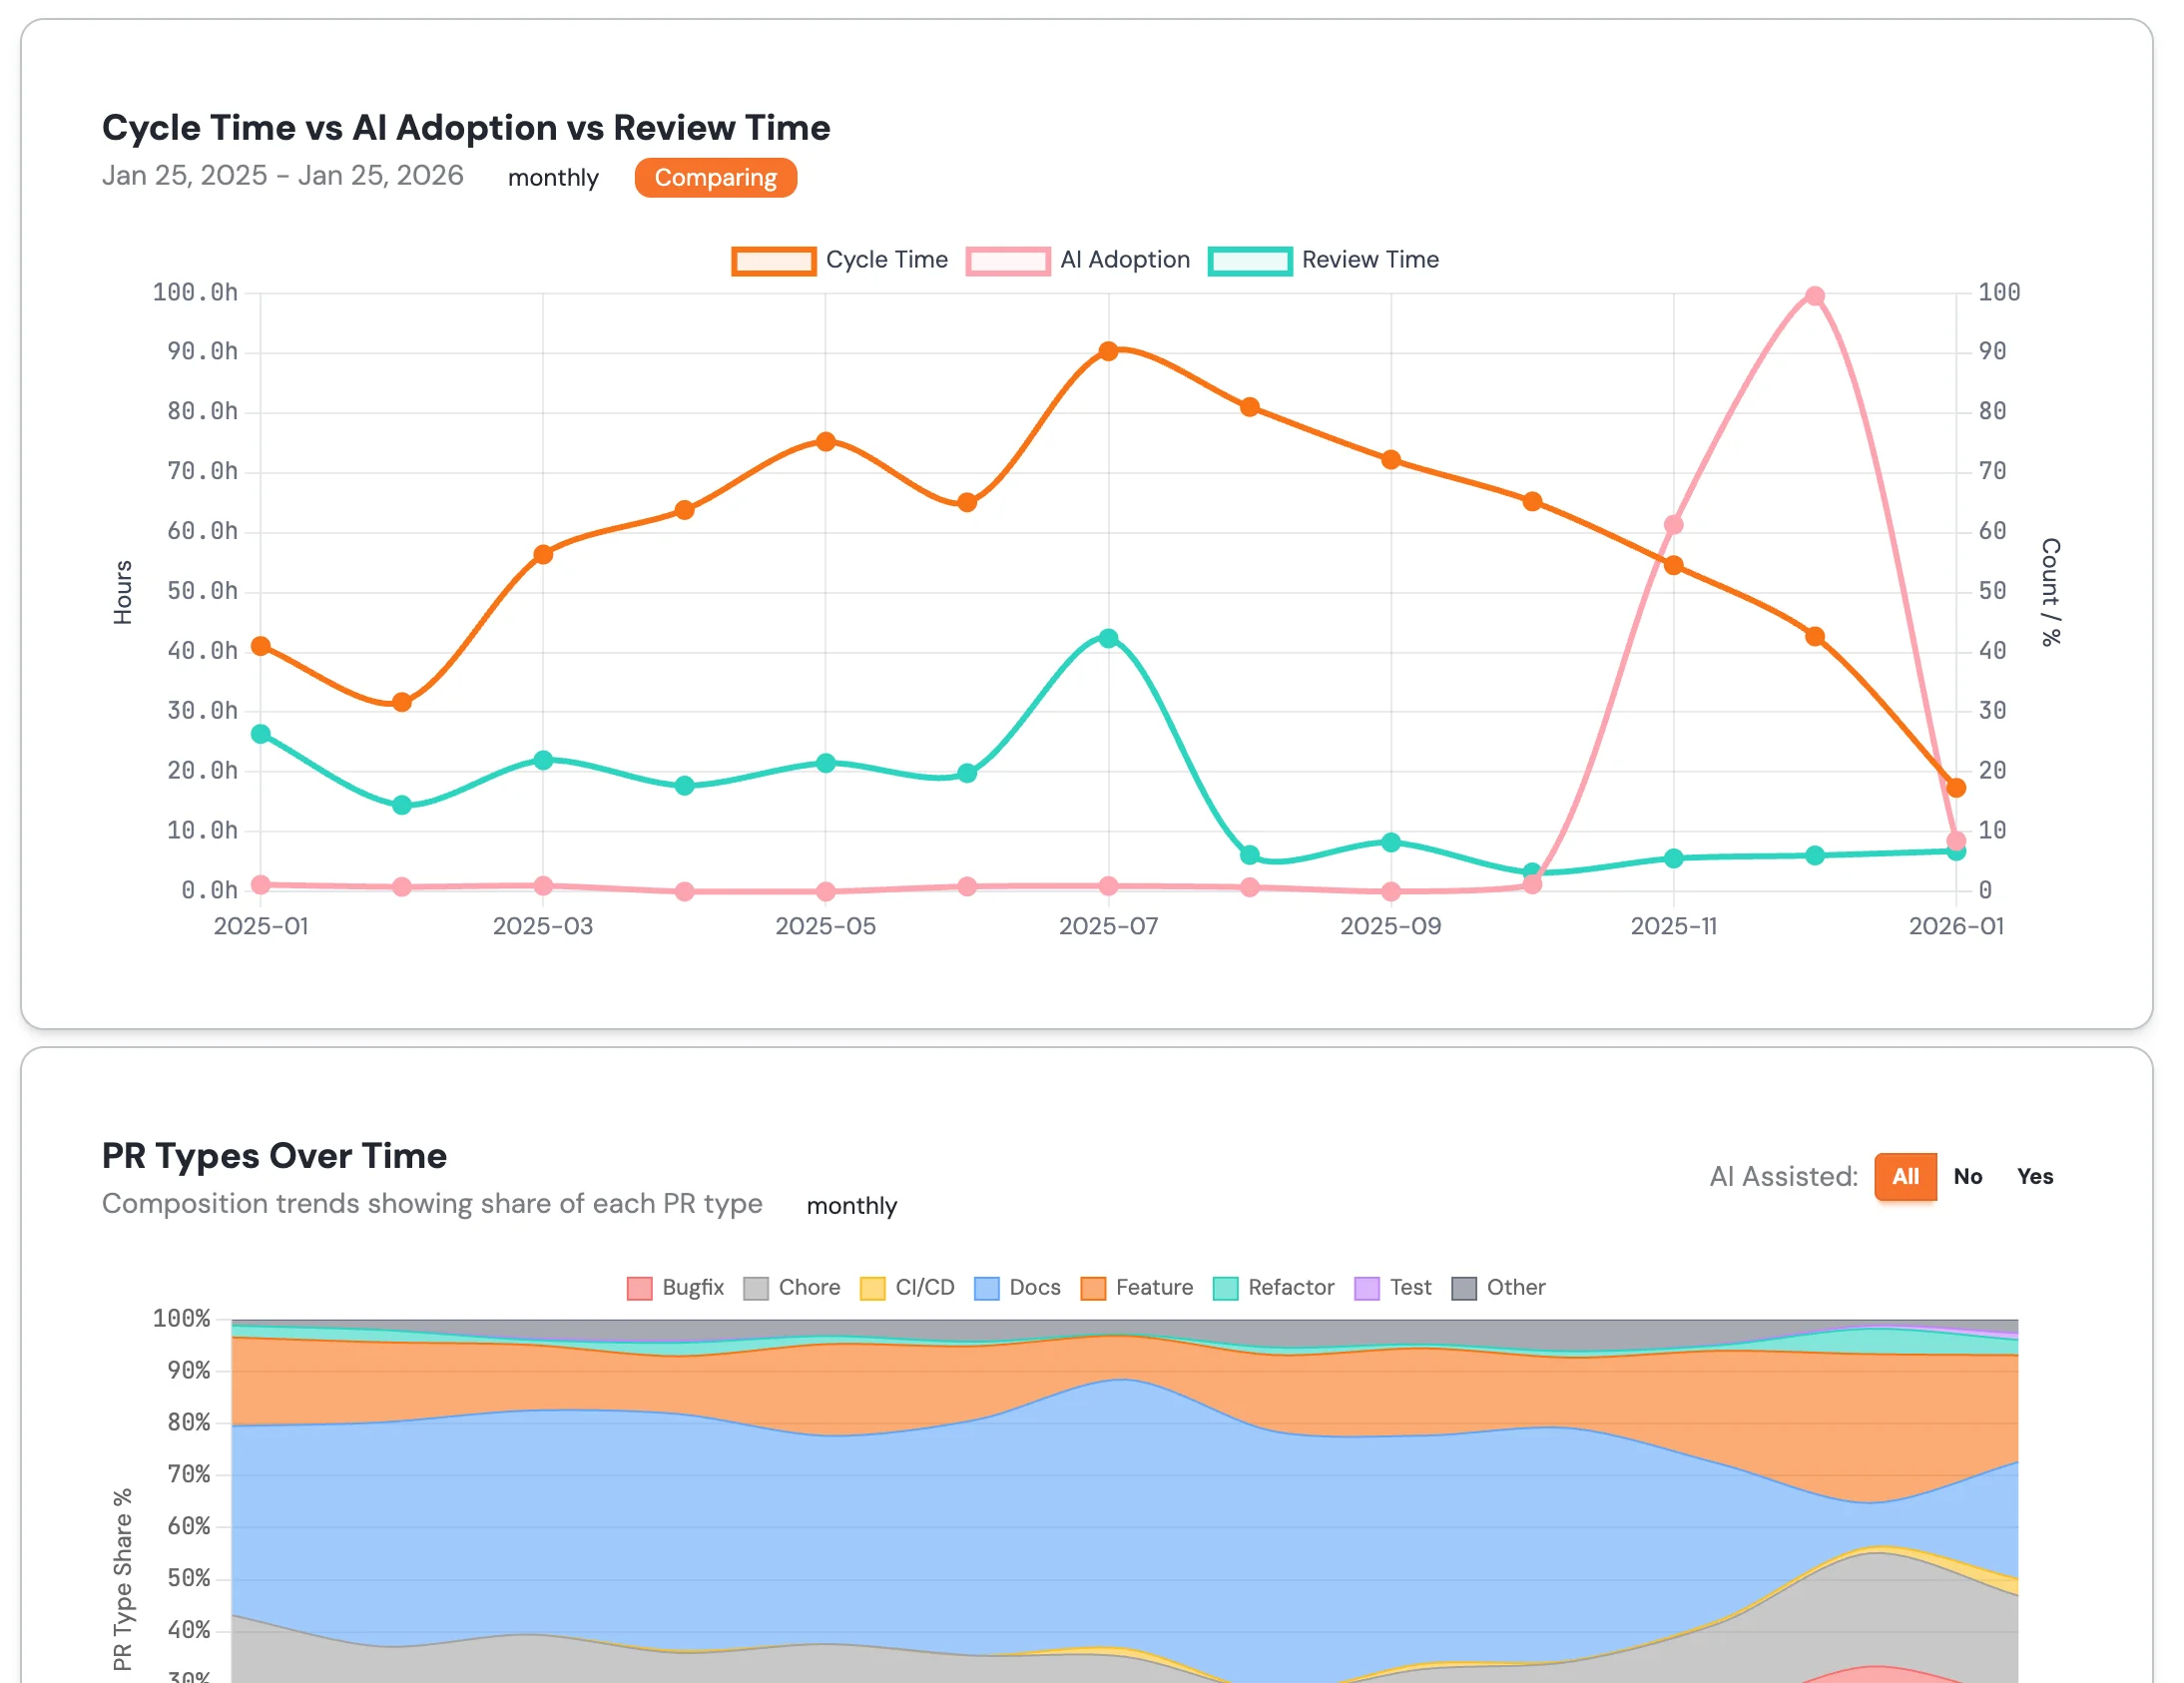
Cycle time trends reveal bottlenecks. PR size distribution shows if PRs are staying small.
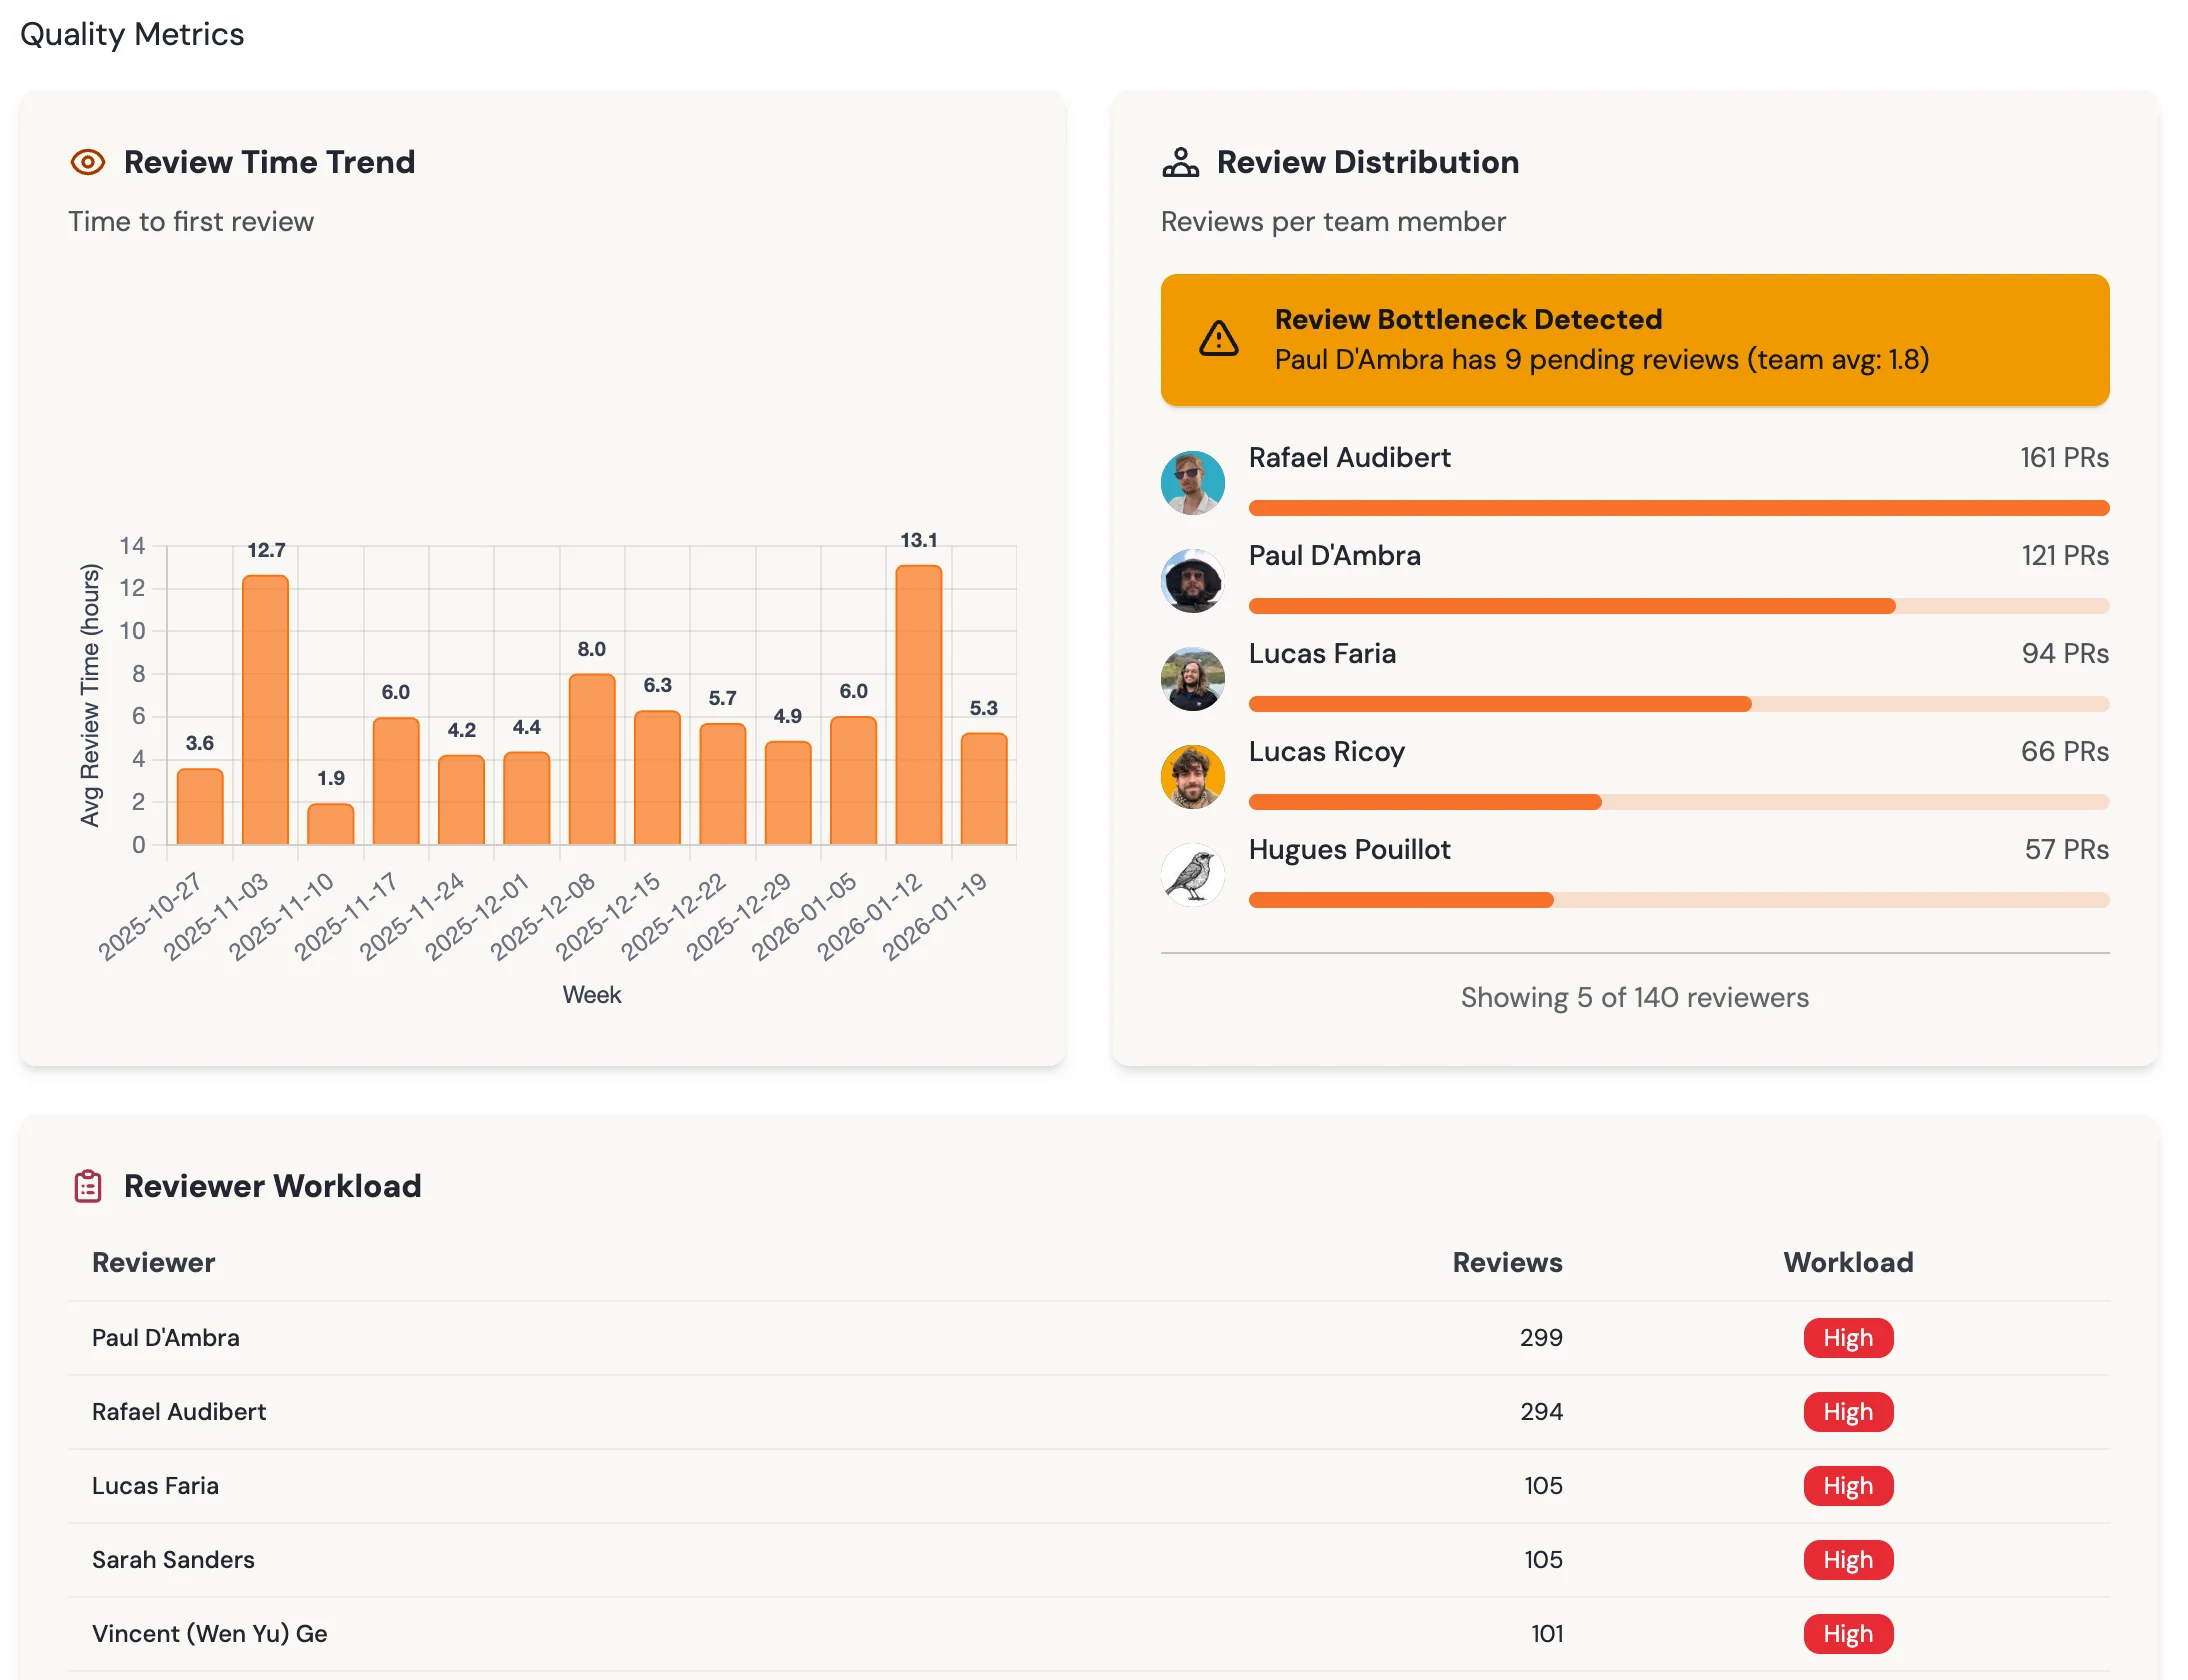
Track review rounds, revert patterns, and large-PR risk. See where quality problems start instead of learning from the incident report.
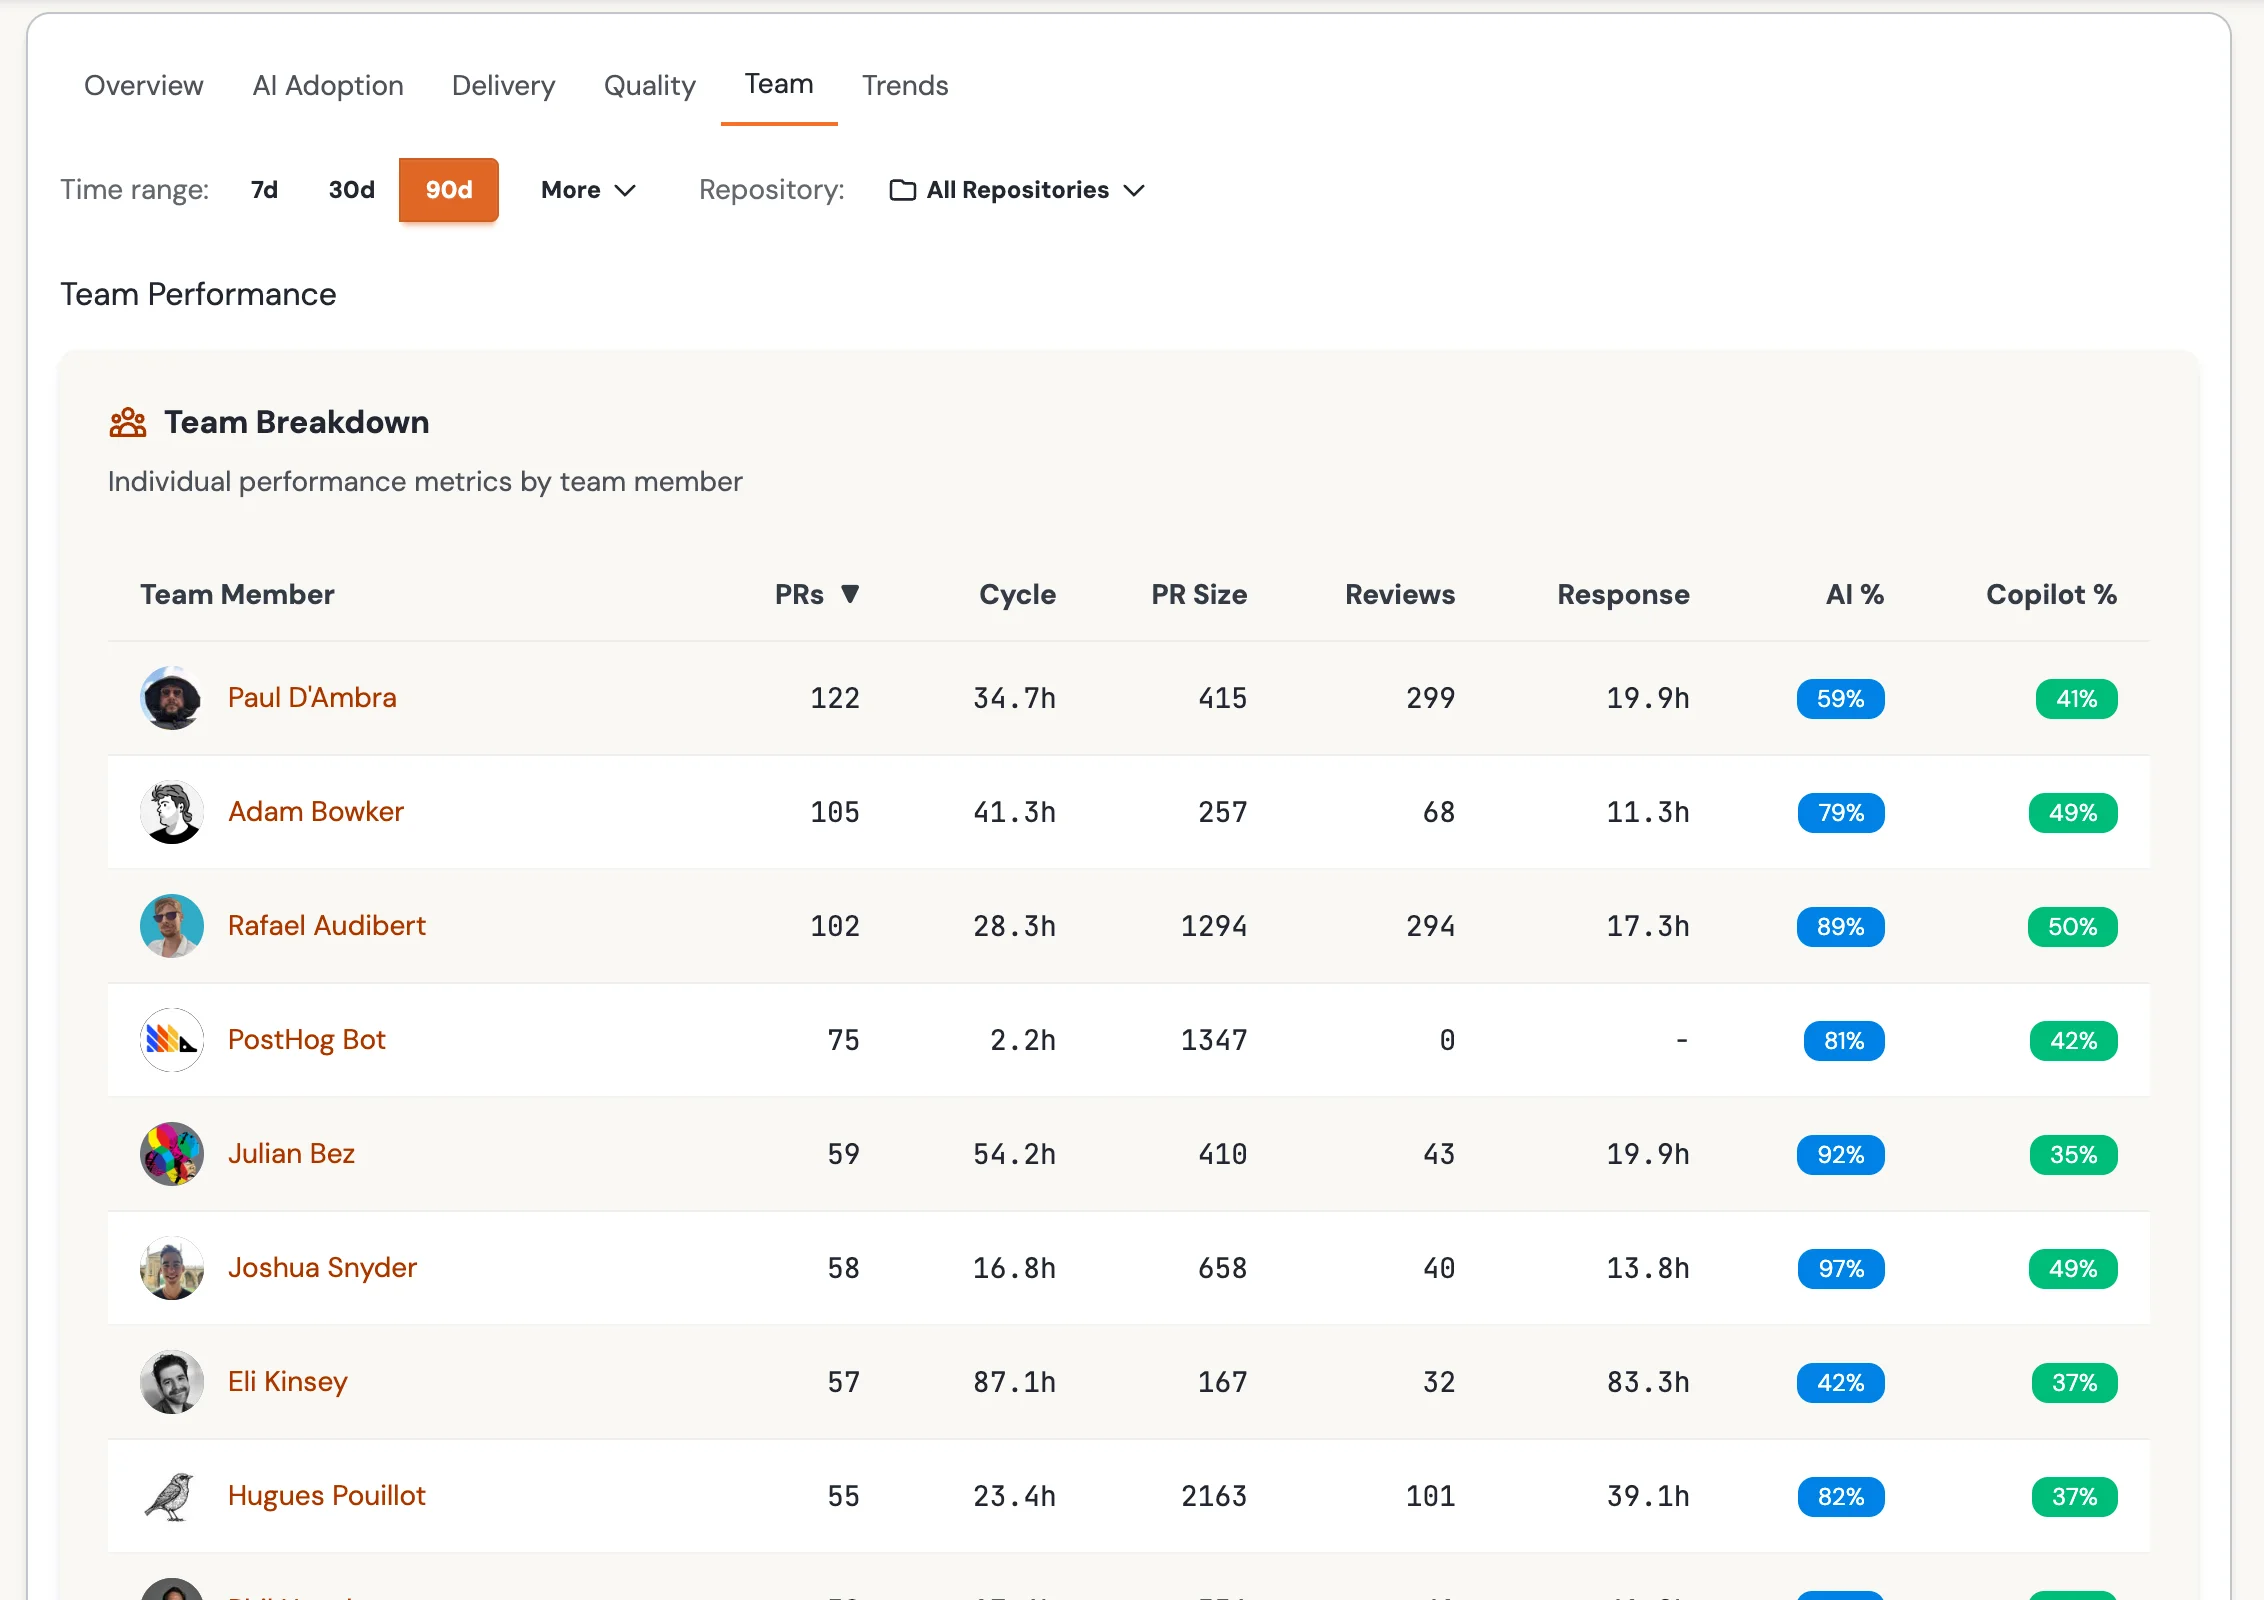
See reviewer workload distribution and contributor flow without turning the dashboard into a leaderboard.
12-month rolling view. Compare delivery metrics year over year and use AI-related signals to test whether outcomes move with adoption.
Use PR Explorer to filter, annotate, and export the data behind these metrics.
Open PR Explorer →Connect GitHub and get cycle time, review load, PR flow, and trend visibility in minutes.
Free during Alpha. No credit card required.
Start Free